Interest for spading continues to grow in Australia
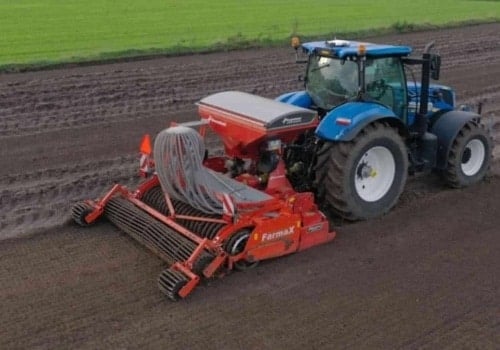
Since 2017, the University of South Australia has used a Farmax spading machine for various field studies near Adelaide (South Australia). Through these field studies, the research team wants to further investigate the effects of spading upon the soil.
University of South Australia
The University of South Australia is a university in Adelaide, South Australia. This University engages in worldwide challenges and opportunities, which is why it maintains (inter)national connections with academic, research and industrial partners. At over 32,000 students, it is also the largest university in South Australia. In 2016, the lectorate for Agricultural engineering, research & design contacted Roger and Sue Groocock of Farmax Spaders Australia, as a result of conversations with Australian farmers using a Farmax spading machine. In 2017, the project received funding from the Australian grain sector (GRDC). The reason for this was the interest of the Australian grain sector in new methods to improve sandy soil with bad yields for grain cultivation. One of these methods was adjusting the soil profile.
In practice, this means that a layer has to be applied to the sandy soil. Clay or an organic material can improve these soils. By mixing the applied clay or organic material into the sandy soil, the soil will be more successful in retaining moisture in dry periods. Because spading is not a widely-known concept in Australia while the applied layer should be properly mixed into the soil, the University decided to initiate field studies with Farmax.
Spading speed effects
During the study performed in 2017 and 2018, the research team focussed on the effects on the soil of various spading speeds. Before this practical research began, the research team performed theoretical preliminary research through a DEM programme. A DEM (Discrete Element Method) computer programme simulates the way soil & soil preparation machines react to each other, allowing for the investigation of various soil preparation methods. Based on the simulation in DEM, the field study was initiated. The objective of the field study was to see whether theory and practice corresponded to each other. If the theory (from the DEM programme) and practice correspond to each other, the effects of variable spading speeds can be investigated and proved scientifically.
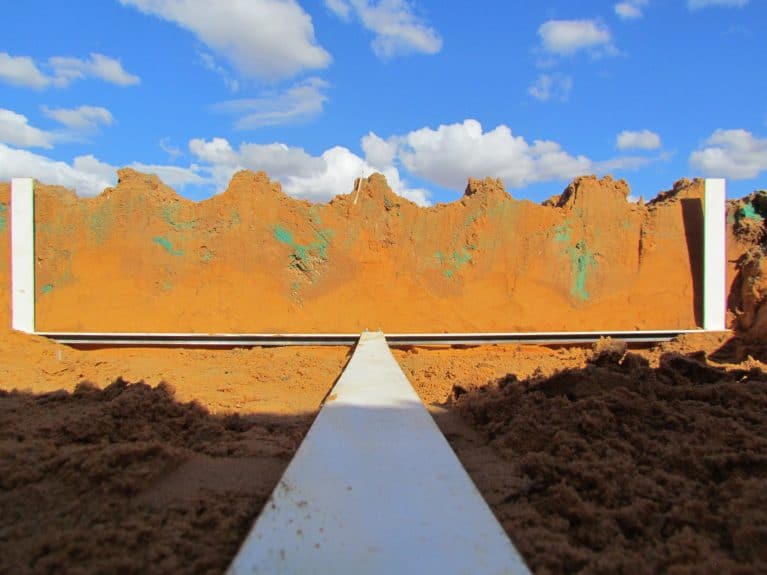
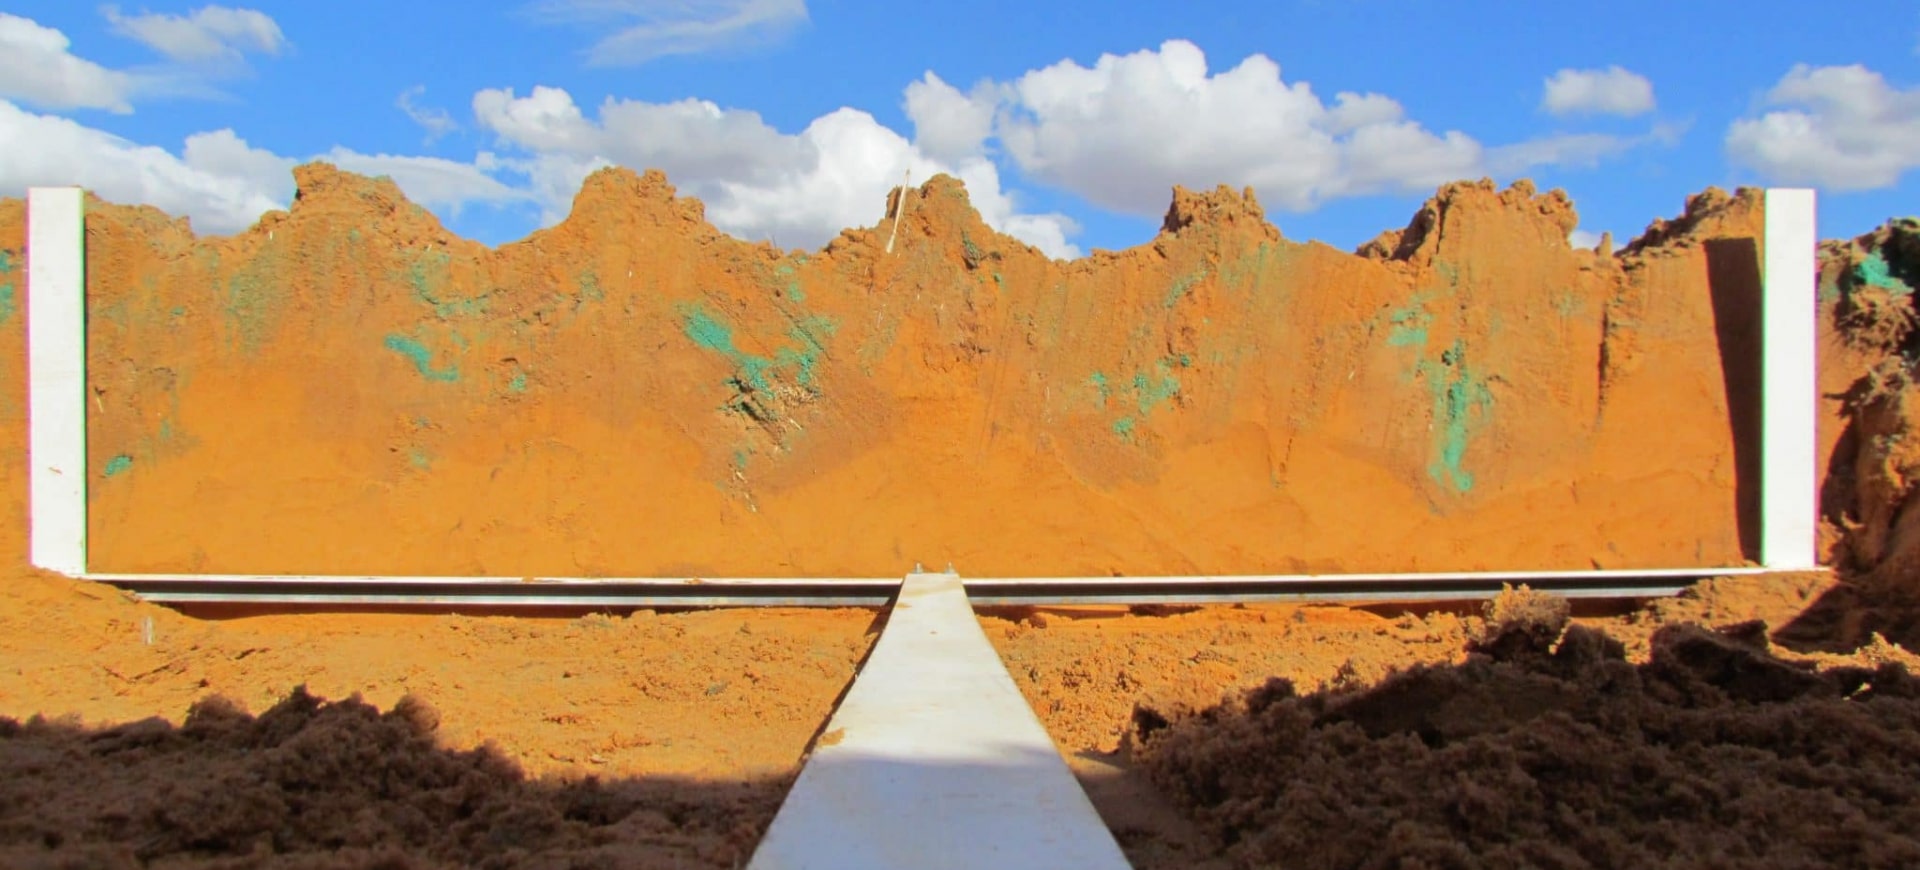
Image 1: soil cross section practical test. Source: University of South-Australia, Saunders.
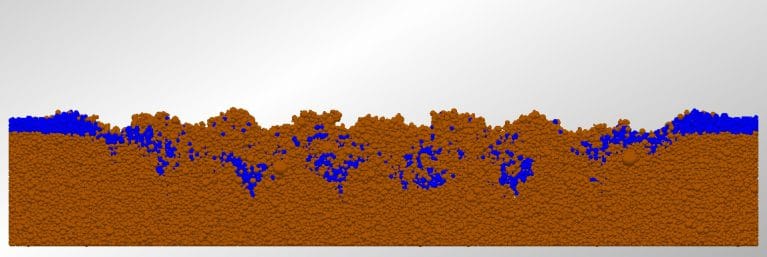
In the autumn of 2018, various practical tests were performed. Blue sand was used to observe the spading effect. Image 1: soil cross section practical test shows how the ratio of the blue sand compared to the rest of the soil. All images of the various soil cross sections were analysed using the DEM programme, resulting in a schematic view that linked the practical results and the DEM simulation. In image 2: DEM simulation and practical results, the similarities can be seen. The blue dots in image 2 correspond to the blue dots in image 1. The red dots in the simulation were programmed using the DEM programme. This simulation was the result of formulas in the programme and the blue dots from the practical test.

Image 2: DEM simulation and practical results. Source: University of South-Australia, Saunders
The right of the table (vertical axis) shows the depth in the topsoil in millimetres. The horizontal axis shows the width of the cross section in millimetres. The graphical results in both figures are highly similar. The results of both tests from image 2 were combined and translated to mathematical formulas in which the effects of various spading speeds were scientifically simulated. Because theory and practice are combined, a realistic representation can be made for further research and testing. Based on this information, overviews can be made of the mixing effect at various spading speeds.
Based on the theoretical and practical tests, the University made an overview in which they showed the effects on the soil of various spading speeds, see image 3: Soil results at various spading speeds.
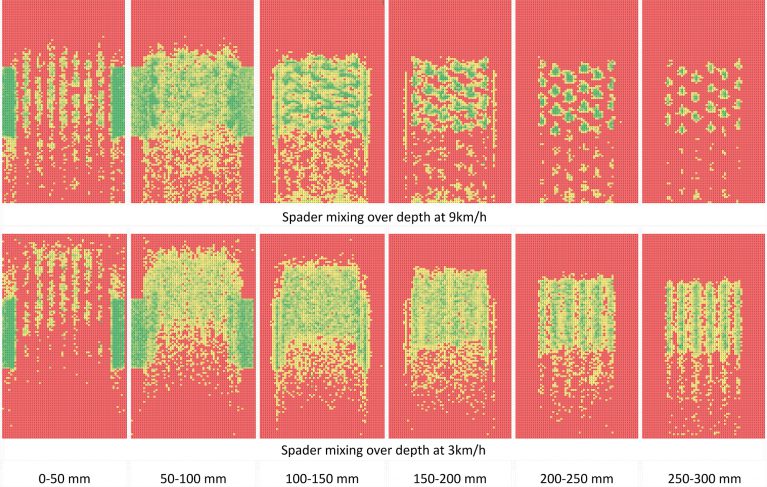
Image 3: Soil results at various spading speeds. Upper row 9km/h (6 mph) bottom row 3 km/h (1.85 mph). Source: University of South-Australia, Saunders.
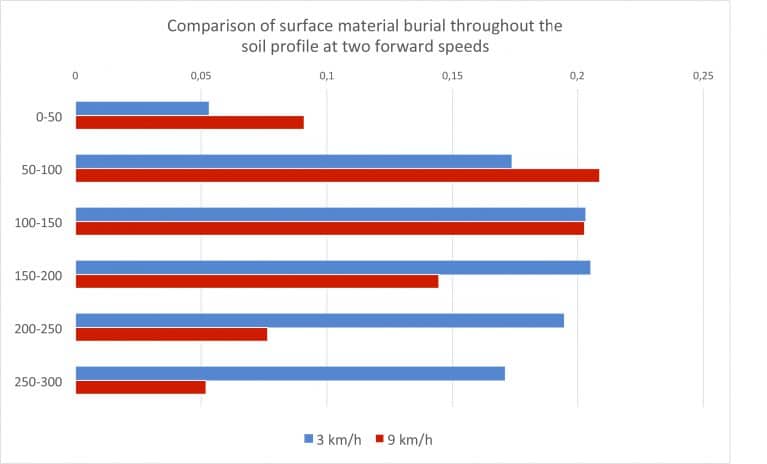
Chart 1: Mixingresults through the soil at two various spading speeds.
For each 5 centimetres (1.97 inches), a schematic overview was made at 9 km/h (6 mph) and 3 km/h (1.85 mph). For each overview, the red colour in the image represents the soil that was not mixed through the topsoil. The greener the image, the better the mixing effect in the layer concerned. The figure shows that the spading result deeper in the soil at 9 km/h (6 mph) shows a digging effect rather than the intended mixing effect of a spading machine. At lower speeds, the mixing effect of a spading machine perseveres even deeper in the soil.
In addition, a table was made using the DEM programme based on image 2, showing the mixing result of the layer in question. The percentage on the horizontal axis shows the percentage of that layer that was mixed through the entire soil, categorised into a driving speed of 3 km/h (1.85 mph). (blue) and 9 km/h (6 mph) (red). The image shows that, from a depth of 10/15 cm (3.94-5.91 inches), the mixing performance significantly decreases at a speed of 9 km/h (6 mph).
At a speed of 9 km/h, compared to 3 km/h, the mixing performance is almost 50% better at a depth of 0 to 5 centimetres.
Overall, it can be concluded that the driving speed (9 km/h/ 6 mph or more) certainly has a negative effect on the mixing performance of the spading machine in the soil.

Download the free magazine of Farmax spaders and seeders
In this magazine, we will explain the spading method of soil preparation and state its advantages in comparison with ploughing. There will also be a brief explanation of all types of spaders and several customers share their experience with our spaders.
